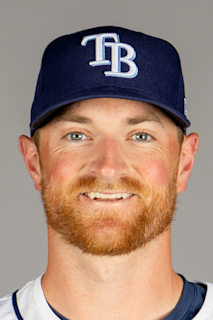
 Drew Rasmussen
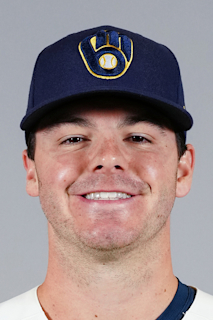 Logan Henderson
Model pick
Brewers
Win probability
56.5%
Unlock the full board
Create a free account to see the model's pick and win probability.
Register FreeLive from MLB Stats API
Team Stats

Rays
Record
98-64
Win%
.605
Games Back
--
Run Diff
+86
Last 10
5-5
Streak
L1
Defense Rank (Fielding %)
18th of 30

Brewers
Record
103-59
Win%
.636
Games Back
--
Run Diff
+214
Last 10
8-2
Streak
W5
Defense Rank (Fielding %)
8th of 30
Head-to-head · live from MLB Stats API
Team Stat Sheet
RaysBrewers| Lineup Production | ||
| 4.5 | R/GRuns scored per game | 5.1 |
| 0.326 | OBPOn-base percentage | 0.341 |
| 0.728 | OPSOn-base + slugging | 0.744 |
| 0.258 | AVGBatting average | 0.258 |
| 169 | HRHome runs | 154 |
| 736 | RunsRuns scored | 832 |
| 1145 | KBatting strikeouts | 1383 |
| 514 | BBWalks drawn | 668 |
| Pitching Staff | ||
| 4.0 | RA/GRuns allowed per game | 3.8 |
| 3.70 | ERAEarned run average | 3.51 |
| 1.140 | WHIPWalks + hits per IP | 1.180 |
| 8.3 | K/9Strikeouts per 9 IP | 9.6 |
| 2.5 | BB/9Walks per 9 IP | 3.2 |
| 7.7 | H/9Hits per 9 IP | 7.4 |
2026 season-to-date team stats, live from MLB Stats API.
Analytics
Model Signals
RaysBrewers| 43.5% | Win ProbabilityLean · Signals agree | 56.5% |
Team strengthPythagorean win profile +0.083
| ||
Starting pitcherLast-five-start FIP -1.06
| ||
BullpenRolling 7-day WHIP +0.309
| ||
Hitting formAverage OPS edge · L3/L7/L15/season +0.053
| ||
1st-inning run prediction based on today's real lineups and starters
YRFI / NRFI
Model leans
NRFI 62.3%
37.7% YRFI · 62.3% NRFI
Why
Rays: NRFI in 3 straight - NRFI in 4 of last 5
Brewers: NRFI in 3 of last 5
Drew Rasmussen: has allowed a 1st-inning run in 3 straight starts
Logan Henderson: no 1st-inning run in 1 of last 1 starts
A pick only becomes a play once the model is confident enough (65%+ for YRFI, 35%- for NRFI). No sportsbook line exists for this market yet, so this reflects the model's own confidence rather than an edge against posted odds.